


What Are Key Performance Indicators (KPIs) in general?
Key performance indicators (KPIs) represent effectively selected quantifiable measurement of the company results and figures. KPIs selection primarily helps companies to set their strategic goals in terms of each of the business processes.
Three dimensions of KPIs that you need to know:
1. KPIs for an accounting firm, and also for any other firm measure company success by comparing actual performance with targeted performance, historical performance, or industry performance.
2. When we say that accounting firm invoices 2 million USD per year that is a nice figure, isn’t it? But that is only an absolute figure and cannot show the level of success. That is why we measure the performance of an accounting firm with the relation of two or more figures. KPIs represent financial figures presented as ratio numbers such as total profit in relation to sales etc.
3. KPIs do not necessarily measure financial figures. KPIs can be settled to measure more soft performance such as client satisfaction, clients churn, employee satisfaction, etc.
Accounting industry KPIs insights
According to ResearchAndMarkets.com, the accounting services on a global level reached a value of nearly $574.4 billion in 2019. The growth rate (CAGR) is 5.7% since 2015.
According to the IBIS World, the accounting services market in the US will reach 107.6 bn in 2021 with an annual growth rate of 0.1%.
For sure, profitability is one of the most attractive performance indicators in any industry. CPA innovation publishes that accounting, tax preparation, bookkeeping, and payroll services was one of the most profitable small business industry in 2017. According to their sources, a pre-tax net profit margin of 18.4%, which is double the average US private company net profit margin of 8.9%.
Our performed analysis from the Thomson Reuters database of 68 independent and most representative EU accounting companies shows interesting results. Based on financial statements for the last three available years median net profit margin 6,19%.
 Employment growth
 Employment growth
According to the US Bureau of Labor Statistics, the employment of accountants and auditors is projected to grow 4 percent from 2019 to 2029. According to their occupation research, three are 1,436,000 accountants and auditors in the US that are declared under the Financial Specialist category.
That means the total hours they spent on work is about 2,699,680,000 hours!
The above figures can be used for the calculation of one of the most important KPIs, the gross hourly rate. Dividing total services value with total hours we get approximately 40 USD as the average gross hourly rate!
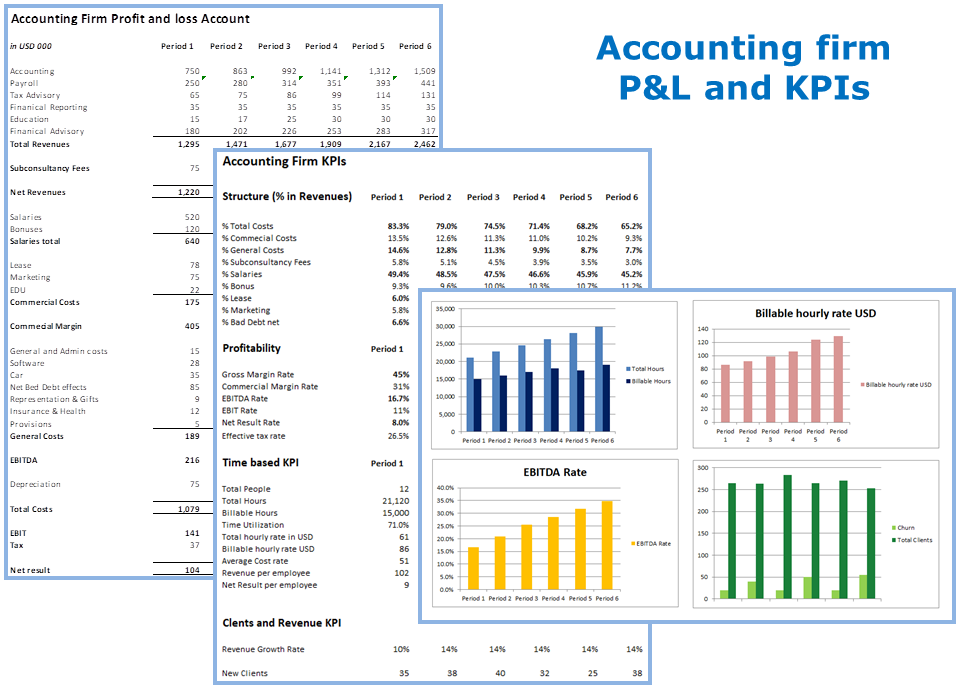
Let we begin from functional Profit and Loss Account
Functional Profit and Loss Account (P&L) represents a specific reporting form that reflects the most important functions of creating a profit. Functional Profit and Loss accounts enable the calculation of significant KPIs of an accounting firm. Accordingly, it is very important to have the following categories in the P&L of an accounting firm: revenues pre-service lines, sub-consulting fees, salaries and bonuses, marginal revenues and profit margins, commercial costs, commercial margin, general costs, EBITDA, EBIT, taxation, tax rate, and net results.

Download excel model: P&L and KPIs for Accounting
Revenues presentation
The rule of thumb is that P&L should contain revenues per basis service lines.

In this way you can do some of the very effective analytics:
- Structure of each service line in total revenues
- Historical variance analysis each service line revenues
- Contribution to growth analysis
Sub-consulting fees and Net revenues
Sub-consulting fees represent the costs of using an external expert to support you in providing services to clients. Since those experts are not employees of the company their costs should be separately controlled. In the bottom revenue line, the net company revenues are calculated as total fees toward client minus Sub-consulting fees.
Salaries
Salaries and bonuses are the most direct costs. That enables the accounting firm to calculate gross margin as the difference between net revenues and total wage costs.

A deeper analysis should show the structure of salaries. How much cost is related to people ended on performing services to the Clients and how much cost is related to other activities such as administration, business development, etc. For the most precise analysis we recommend of use time tracking of employees per activity, so the cost will be automatically generated for each activity. In the second part of this article, we present how to easily do that with timesheet software for accountants.
Commercial costs and commercial margin
Commercial costs represent costs that are basically related to commercial activities such as marketing as well as indirectly related to staff.

General Costs
General costs include costs related to the general business administration. Those costs are usually related to insurance, software costs, cars, office material, maintenance, mailing and phone costs, internet and server costs, etc.

EBITDA
EBITDA represents earnings before interest, taxes, depreciation, and amortization.
EBITDA measures a company’s overall performance and represents an alternative to net income.
As there is no legal requirement for EBITDA disclosure, according to the U.S. generally accepted accounting principles (US GAAP) it can be reported using the information in accounting figures/ trial balance or general ledger.
This is not usual to report EBITDA in the P&L of an accounting firm, but we trust that each profit metric should be reported due to the recommended analysis.
Profit before tax and net result
Profit before tax is also referred to as earnings before tax (EBT) or pre-tax profit. The measure shows the difference between total company revenues and expenses.

Structure related KPIs for an accounting firm
The accounting firm KPIs related to cost structure could be as follows:

Total cost share in total revenues is an indicator of profit. A higher ratio means lower profitability.
Marketing costs share as relevant KPIs for accounting metrics indicate how much USD is invested in marketing you need to earn 1 USD of revenues. Calculation of marketing costs could be a big challenge for an accounting firm. The marketing-related costs are not only costs for the promotion of business services, sponsorship, etc. Do not forget that marketing is the process of planning and implementing ideas, products, distribution, and promotion in order to satisfy client needs.
There is two option for calculating and reporting marketing costs. One is very similar – just collet all direct marketing expenditures and record the invoices for marketing service provides to your books.
Another one is the most sophisticated. Based on this option, the marketing cost center should include the work of your staff who is preparing newsletters, promoting activities, writing a blog about some accounting topic, developing new services, etc. Research shows those accounting firms reallocate their resources from external sponsorships and promotion to internal content writing (for websites and blogs). In the case of 100% of such reallocation, this line in P&L would be empty if we apply the approach explained in the first option. Therefore, the detailed allocation of expenditures is a must. Only in that way accounting firms can calculate and measure their efforts.
As marketing is a key driver of business growth, our recommendation is to carefully calculate and measure this KPI for accounting firms.
Share of sub-consulting fees in total revenues shows how frequently and in which volume we rely on external resources. A high ratio means we have a lack of internal expertise in our accounting firm. A high ratio impacts our net profit margin. On the other side, since some external experts usually have extraordinary knowledge, they are using them to enable firms to increase sales of their services and adding up relevant mark-up on subcontractor costs. As per our judgment, this ratio should not exceed 5-10%.
Net bad debt share in revenues is an indicator of the quality of account receivables. Besides this KPI, in term of AR, an accounting firm may apply specific AR indicators, such as:
- total AR overdue in total AR
- above 60 days overdue in total overdue AR
The general recommendation to accounting firms is to calculate selected ratios that are most effective to their business and follow that in three directions:
- Historical movement
- Measurement in relation to budgeted KPIs
- Measurement in relation to competitors (accounting industry)
Profitability as basic KPI for accounting business
There are a lot of profit margin calculations, but basically, three types (degrees) of margin is very useful metrics to discover what is either key driver of profit or key waster of profit.

Gross margin rate
The gross margin rate is the most direct indicator of the profitability of an accounting firm. It should be calculated as the difference of net revenues and expenditures related to employee benefits divided by total revenues. In the case revenues grow at the same rate as salaries; the gross margin rate would be stable. However, if revenue grows slower than salaries, the gross margin rate will be lower. Still, in this case, the total gross margin could be higher in absolute amount. It is always up to the accounting firm partners what does they prefer, higher gross margin in absolute amount or higher profitability.
The second-degree rate is the committal rate. In addition to employee benefit costs, commercial margins include commercial costs as well. So the volume of the commercial costs directly impacts on commercial margin rate.
For each profitability indicator, our recommendation is to compare the actual figure with:
- Historical data
- Budget
- Competitors
Effective tax rate shows how accountants are creative in taxation. It is usually the regular corporate income tax rate adjusted for permanent and temporary differences.
Hourly rates and time-based KPIs
In the accounting business, it is all about hourly rates. Good billable hourly rates resolve many issues and challenges.
The fact is the accounting company sells hours. In the picture below, we see that the observed company sale approximately 30 thousand hours! Each hour is important. Accordingly, accountants need more effective management of hours performed and billed.

I asked one accounting firm partner: How did you earn 1 mil USD. He said: I sold 10,000 hours by 100 USD.
When you have accurate figures about time consumption per each project, working task, client, you can easily calculate and manage the above KPIs for an accounting firm.
Billable hourly rate shows how much USD accounting firm earned per one billable hour on average. The total billable hourly rate indicates how much USD accounting firm earned per total hour. In a case the difference between those two rates is high, time utilization is not appropriate. Therefore the accounting firm has to control time utilization.
By dividing total costs with total hours we can calculate how much one-hour costs.
Even the above calculation is curtail KPIs for an accounting firm, then may consume a lot of time for analysis and data extraction. Accordingly, we recommend the application of online timesheet software that can be easy to use. Later in this article, we will get back to this subject.
Clients and revenues related KPIs

Churn rate
Churn rate is the most favorable ratio as it shows how many clients leave accounting service providers in relation to the total client. In the above example that is 22% in the last period, this is not usual in the accounting industry. But the most relevant ratio figure is churn revenue rate because that is more effective than churn rate. From the example above, the churn revenue rate is lower than the churn rate which implies that customers that leave generated a lower level of revenues.
Even though the churn rate can be a strong indicator of client satisfaction, that ratio should be observed in relation to client profitability. From the example above, the company acquires new 36 highly profitable clients, while the loss of 20 non-profitable clients is not a big issue.
To conclude, the main challenge in the accounting business is to serve high profitable clients. Later in this article, we will explain how to track profitability per each client.
Client lifetime value
This KPI is very important for accounting companies because it shows a total lifetime value of an average client.
Life time value = Average Revenue per Client / Churn rate
In order to be more precise, the firm can calculate the present value of the client by application of discounting methodology.
Service per client ratio
At the example below we can see the structure of services per client:

The ratio of services per client will be calculated as 25/13=1.9. That means the accounting firm provides 1.9 different services per one active client on average. If we look at the table we see a total of 78 fields while 25 fields are filled. The service occupancy in the above table is 32%.
We recommend each accounting firm partner establish this KPI for its clients.
In order to increase the above ratio, the cross-selling activities should be properly settled.
Variance analysis
Variance analysis of KPIs for accounting firm could be historically analysis and budget-related analysis. In other words, KPIs should be compared with last year’s achievements and expectations.

In this case, you have insight into each product (service or service line) periodical revenue you can calculate contribution to growth. This KPI for the accounting firm shows the participation of each service line in total growth.
In the picture above we see that total revenues grow by 6% (216k USD in total). The Financial advisory service line has the biggest contribution to growth with 31% of total revenue increase. Relatively, the highest growth is recorded also at the Financial advisory service line (22% YoY growth).
Besides historical analysis, you can measure achievements to settled goals.

Graphical view
The excel tracking of KPIs is suitable for preparation powerful graphs that can be used for easy monitoring and planning of accounting firm metrics.

How can you manage time-based KPIs?
The best way to tracking these KPIs is an online tool based on time tracking. Time tracking and evidence are an essential foundation for calculation hourly rates, time utilization, project profitability, and employee productivity.
Timesheets management and time tracking should be easy for accountants and other staff!
Discover how does the essential accounting metrics could be managed in Time Analytics online platform.
Time Analytics offer costs and time tracking (billable and non-billable) per each employee, working task, client, project, or service line
Track billable hours and rates
Each accountant gets online access to the time tracking platform for accountants. They just need to fill daily working tasks per client and project or service line.
According to the experience, the daily time for entry is about 6 minutes. In order to be more efficient, Time Analytics offers customized template preparation for all users, in the option “My Templates”. The simple entry form is presented as follows:

Besides the detailed report that will be later explained, company admins (partners) get an excellent dashboard of total hours, billable hours, and movement of time utilization. All figures are compared with achievements from the last months in order to anticipate the trend of these important KPIs for an accounting firm.

Time utilization measurement
Accounting firms should set target time utilization rates as one of the basic KPIs. Time utilization shows how many of the available accountant hours are spent on billable work and how many on non-billable work. Billable hours are driver profitability. Still, non-billable hours are also important for an accounting firm as those are necessary for other relevant activities.
Targeted time utilization rates vary between positions and accountant from accountant.
Usually, senior accountants have the highest time utilization while managers and partners have a lower utilization rate. Due to administrative tasks, juniors also have a lower utilization rate than senior staff.
Insight in value drivers
Value drivers are usually hidden in non-billable hours. By insight into the structure of non-billable hours spent on business development, service innovation, and marketing, the partners are entitled to make an excellent assessment of a manager’s contribution to the company.
In addition to hours tracked per each value-driving activity, Time Analytics enables recording of a number of meetings with new clients, newsletter prepared.
Profitability management
In the example given at the below table total accounting company margin is 10%. Still, if we go into a deep structure, we discover structure to that margin.

What accounting firm should do with loss generating clients? Do partners really possess an accurate insight about profitability per each client?
The crucial challenge is the cost of engagement allocation to the specific client. In Time Analytics, hourly cost is calculated for each accountant. When accountants track their working time to a specific client, Time Analytics calculates total costs related to client and client cost rate.

Besides to cost calculation for each client, timesheet software enables calculation for costs of each service line. Comparing total client revenues with costs partners of an accounting firm have insight into the total margin for each separate client.
Productivity management
An analysis from Time Analytics helps accounting firm partners to understand the productivity level for each accountant or other employee. The advanced reports show total billable and non-billable hours per accountants.
Overtime is one of the basic KPIs for accounting firm productivity. With detailed insight into data, partners can determine the reason for overtime.
Besides, each accountant gets a self-dashboard that helps him to track personal productivity.
Timesheet management
Managers or Partners get full access to the timesheet module and can extract relevant timesheet data for the required period. Timesheets can be listed per each employee, project, client, or task. Comprehensive timesheet could be exported in excel suitable for invoicing or consultant work assessment.

Get a graphical view
Time analytics reports contain valuable graphs as an effective visual tool for presenting data at a glance. The graphs are available for each category: employee, client, working tasks, and projects.

Conclusion
Finally, do not forget, US accountants spend 2,699,680,000 hours per year for their accounting job within accounting firms.
But the question is how they manage that?
In the end, nobody will obtain effective metrics than an accountant.
Start managing your time
FREE 14-days trial – no credit card required